Data products

Everything the toolkit can produce, with examples.

Remote catalog query

Before any local signal processing: decipher.catalog() returns a pandas DataFrame summarising the public audio corpus, and decipher.fetch() downloads matching clips as AudioSource objects.
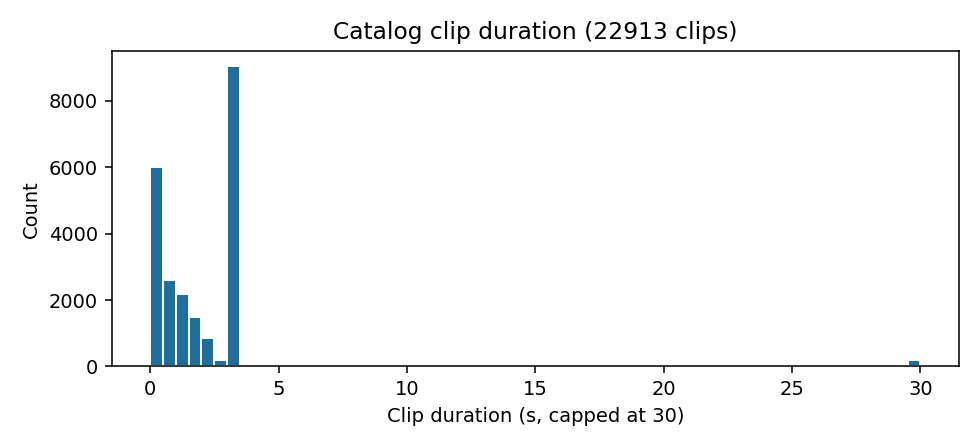
catalog duration histogram
Clip-duration distribution across the full catalog (22,913 clips).
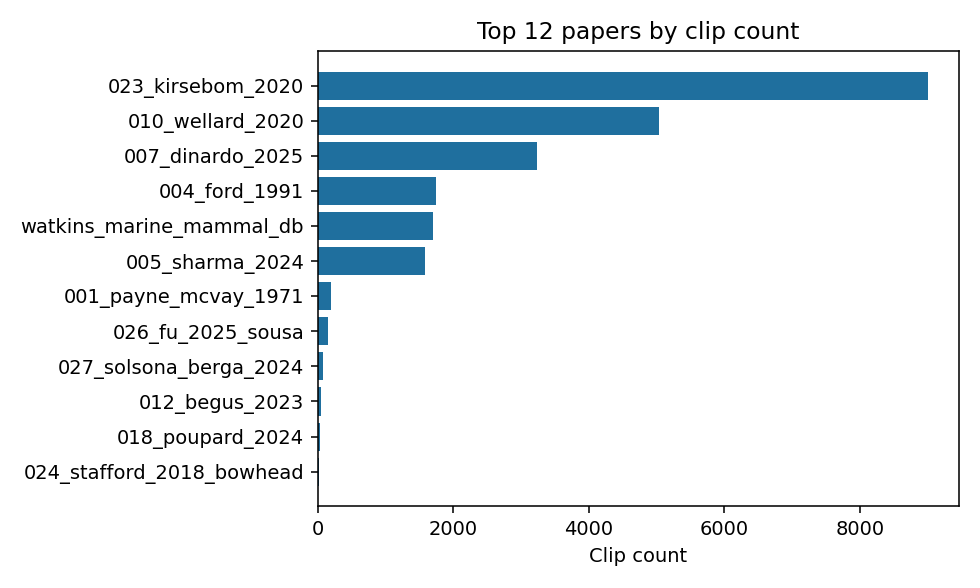
clips per paper
Top-12 papers by clip count.

Loaded audio

Returned by load_audio. Float32 mono with the original sample rate.
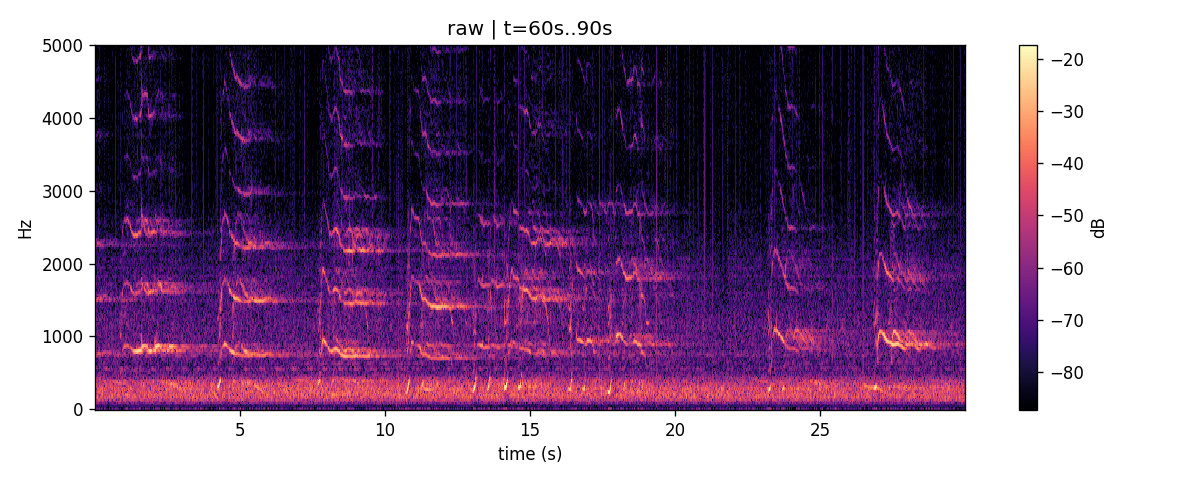
Raw audio + spectrogram
A 30-second excerpt of humpback song.

Bandpassed audio

Zero-phase Butterworth bandpass returned as a NumPy array.
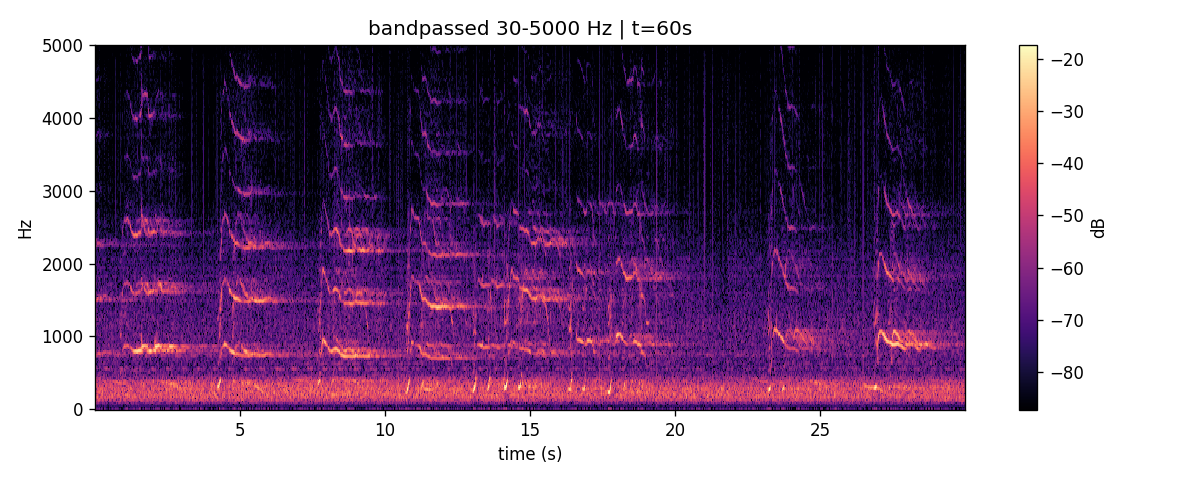
Bandpassed audio (40–4000 Hz)
Sub-band rumble removed; calls preserved.

Energy envelope

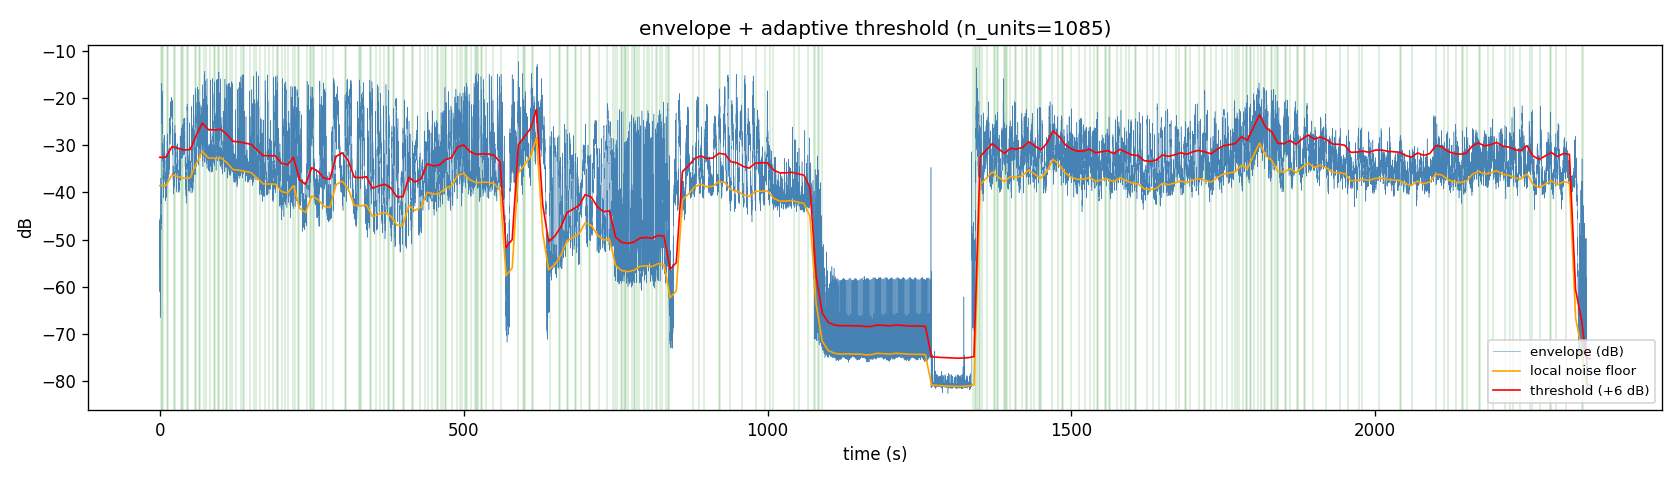
Internal product of detect_units: a smoothed Hilbert or RMS envelope in dB, plotted against the noise floor and threshold.
energy envelope and threshold
Smoothed dB envelope (top) overlaid with the threshold above the estimated noise floor. Above-threshold runs become unit candidates.

Detected units

A list of Unit objects, each with its own playable audio.
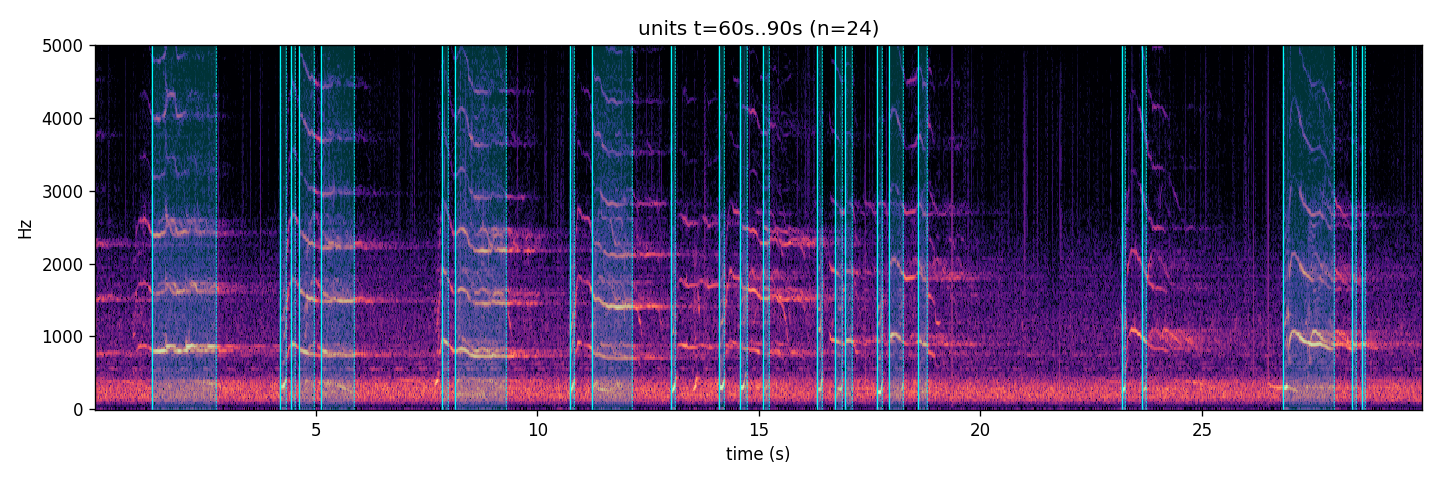
Unit boundaries on the spectrogram
Each red interval is one Unit.
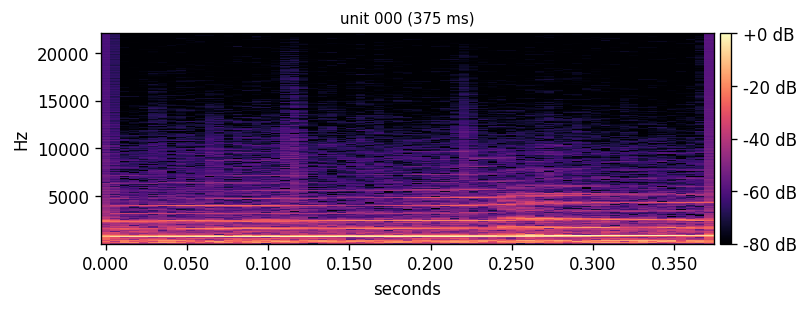
Unit 000 — 375 ms
Unit 000 — 375 ms
First unit from detect_units on the humpback excerpt. 44100 Hz 0.375 s
Unit 001 — 154 ms
Audio-only for a shorter unit from the same excerpt. 44100 Hz 0.154 s
Unit 002 — 270 ms
And another. 44100 Hz 0.270 s
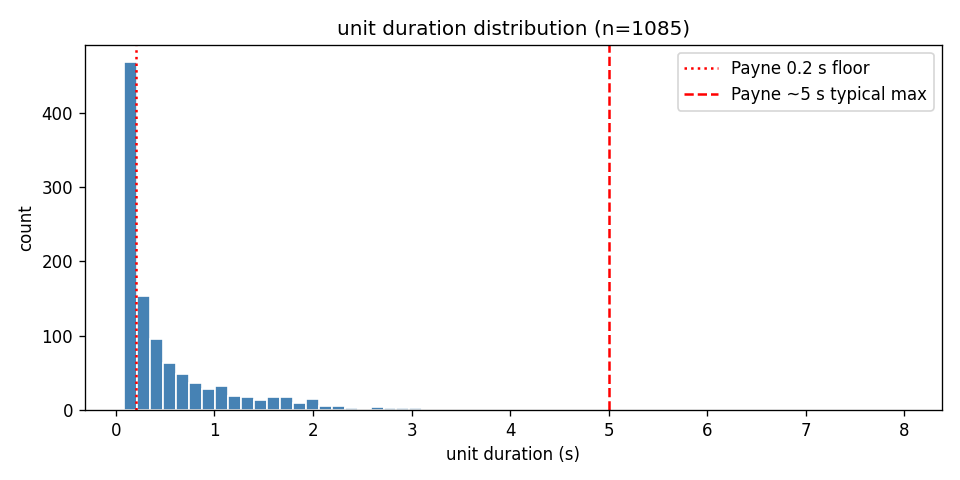
unit duration histogram
Distribution of detected unit durations — useful for sanity-checking the min_dur_s / max_dur_s parameters.

Mel-patch features

Returned by mel_patch_feature: a flattened, time-normalised log-mel patch concatenated with auxiliary scalars (duration, peak frequency, bandwidth). One row per unit.

Embeddings

Two families:

  • AVESEncoder — frozen self-supervised audio embeddings (768-D per frame; pooled to a single vector via pool_mean or pool_mean_std).
  • AutoencoderEmbedder — convolutional autoencoder with a 256-D bottleneck plus an optional decoder for spectrogram reconstruction.

Cluster result

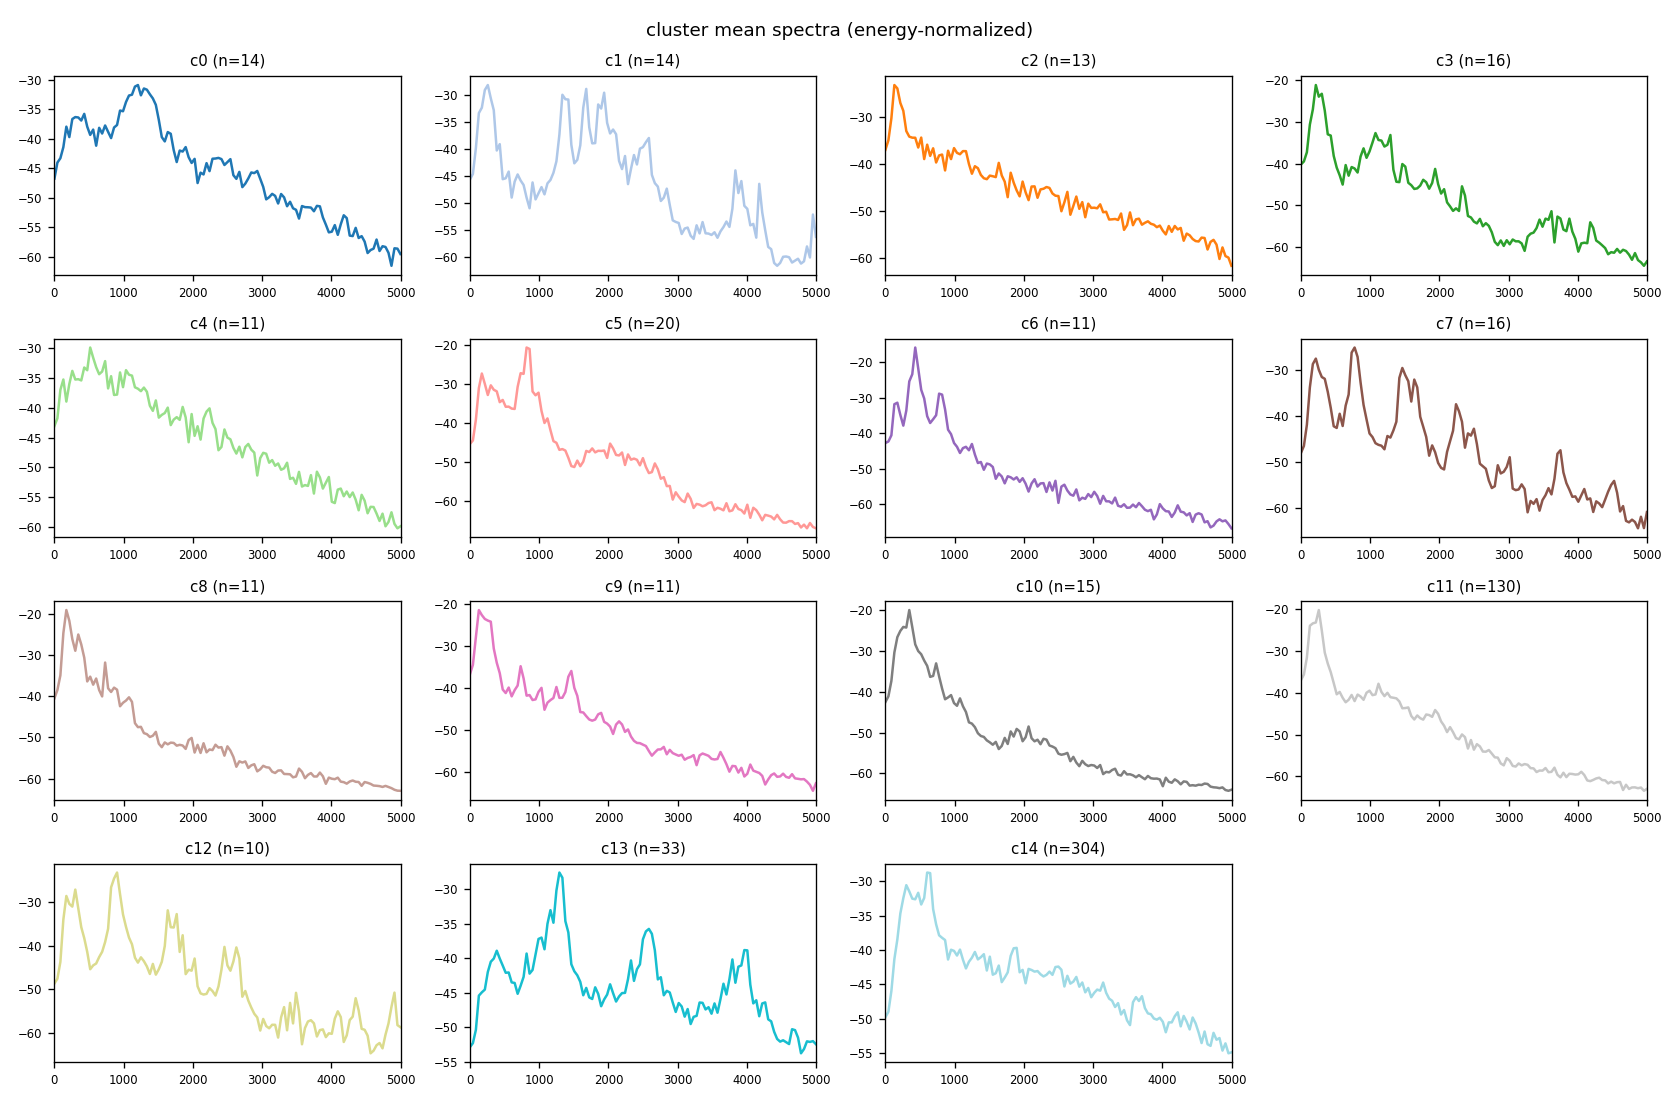
Returned by cluster_features: HDBSCAN labels (with noise as -1), noise-reassigned labels, the PCA-reduced feature matrix, and per-cluster centroids.
cluster mean spectrograms
Mean log-mel spectrogram per cluster — a visual catalogue of the acoustic types the pipeline has discovered.
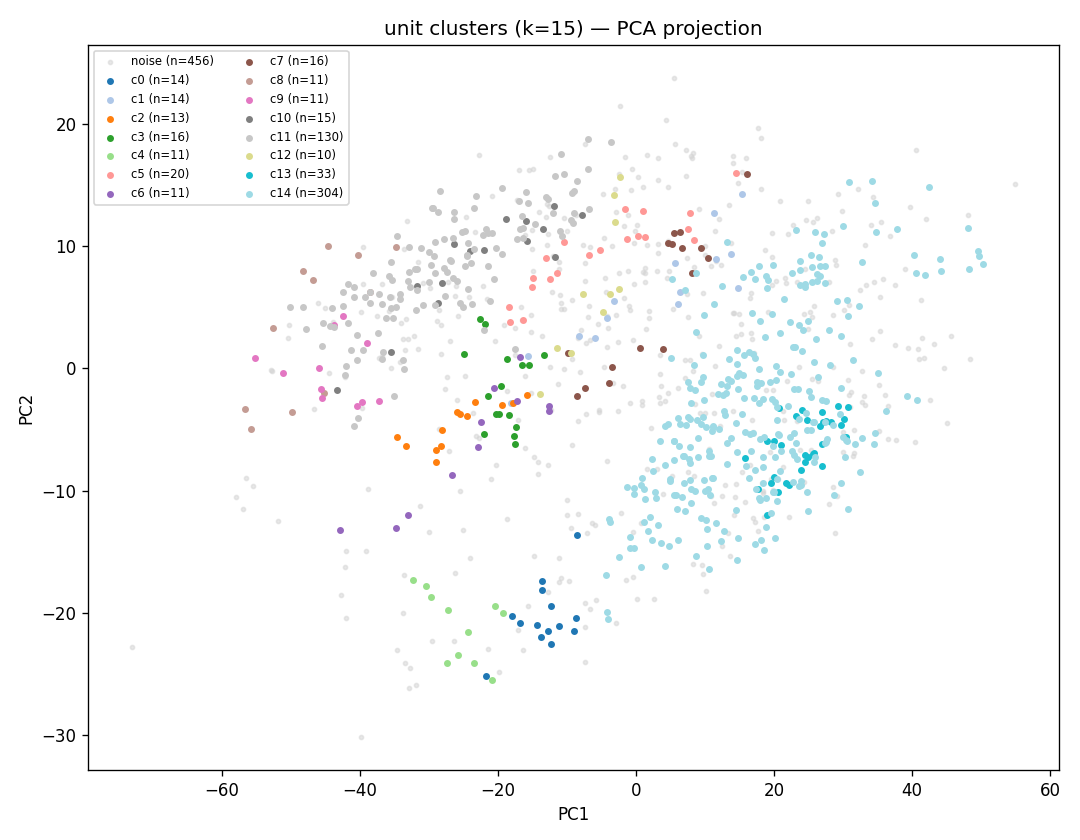
PCA scatter of clusters
PCA-2 scatter of the units, colored by cluster label.

Cluster exemplars

Cluster 00 — exemplar 1
Listenable representative for one cluster.
Cluster 00 — exemplar 2
A second exemplar from the same cluster — they should sound similar.

Symbol stream and sequence statistics

Once you have a SymbolStream, the sequence module yields:
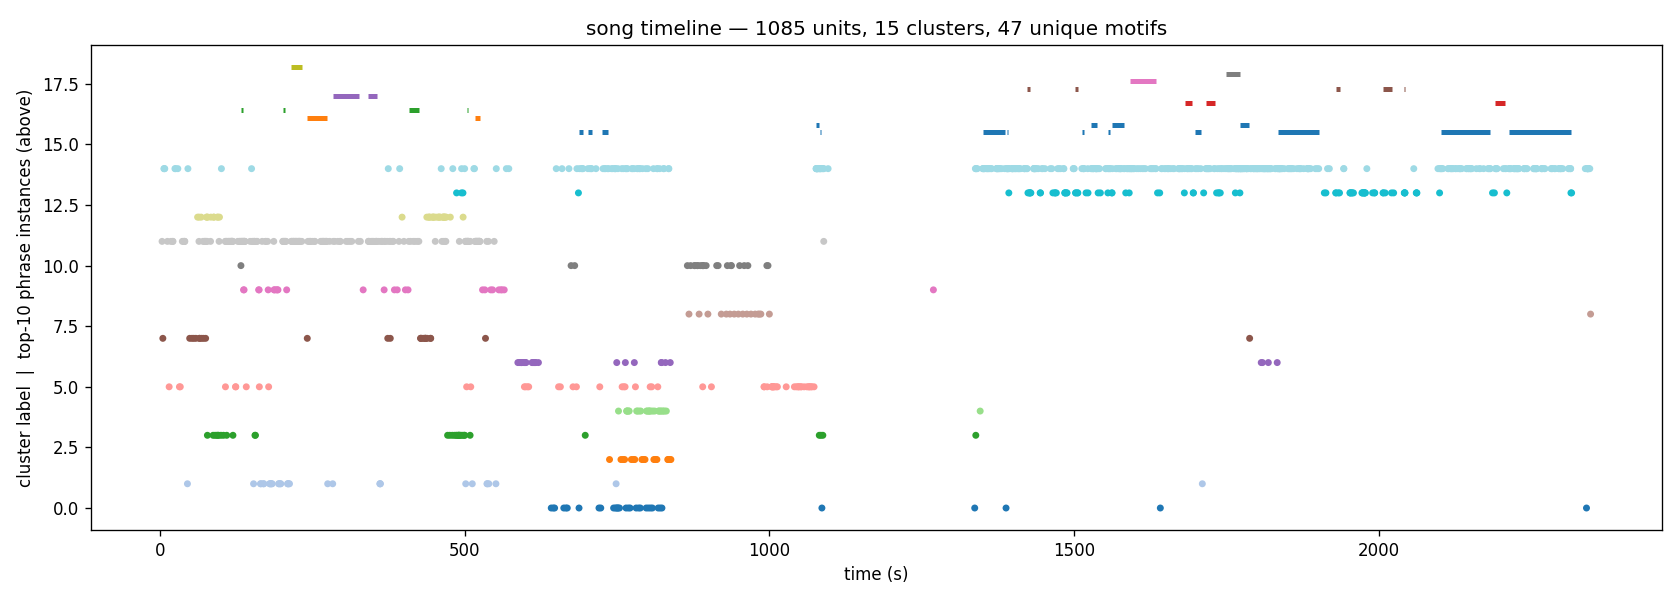
song timeline
Symbol id over time — visualising the categorical sequence.
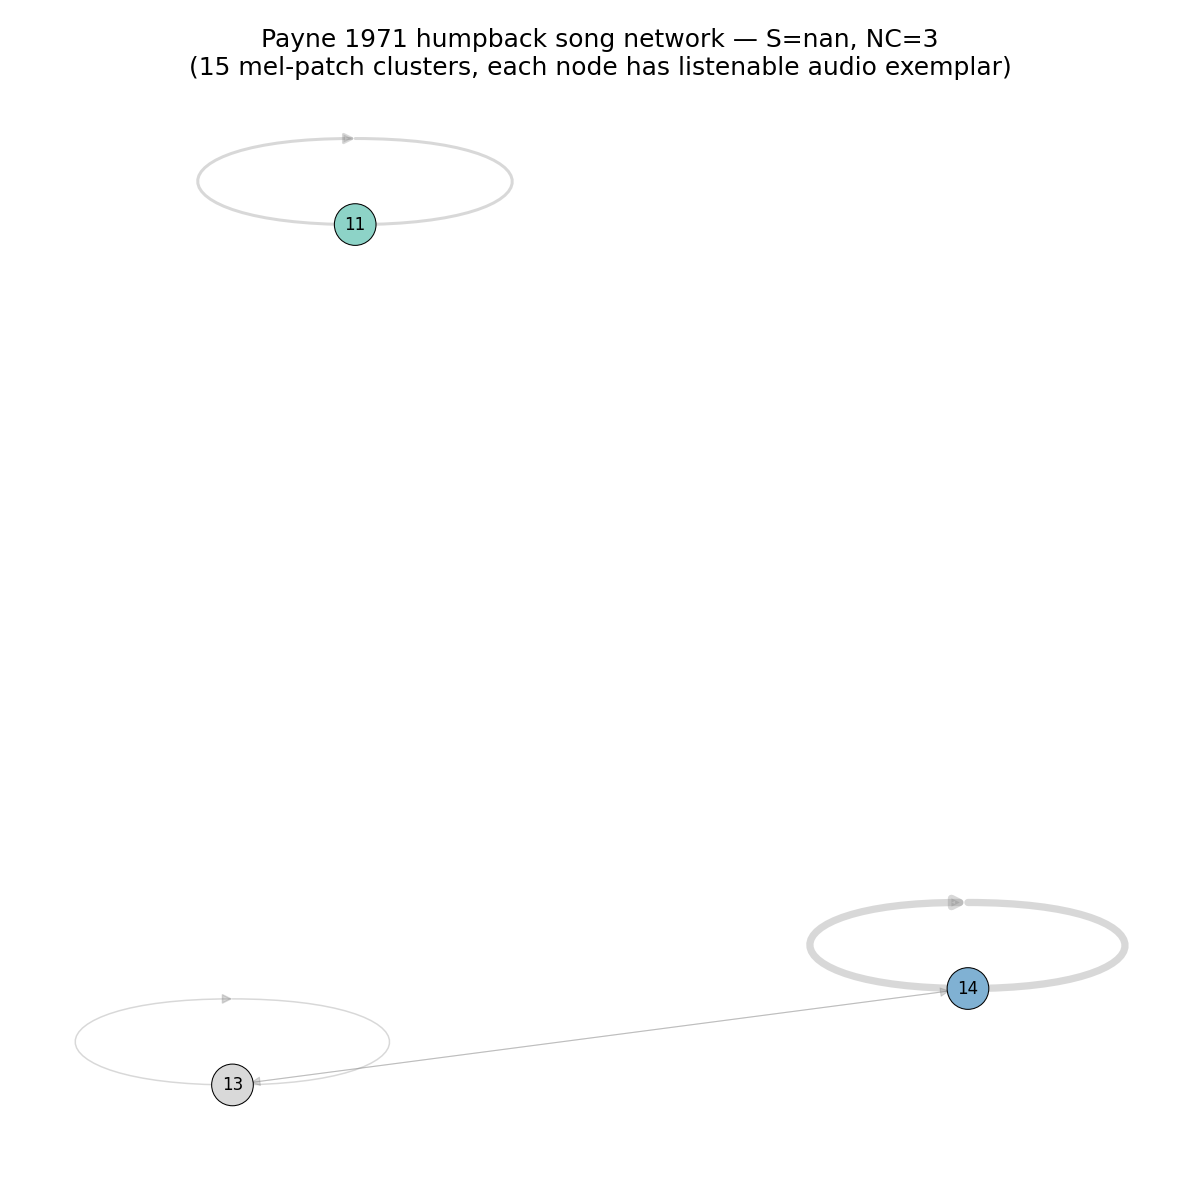
bigram transition network
Bigram transition graph from bigram_transitions.
Zipf rank-frequency
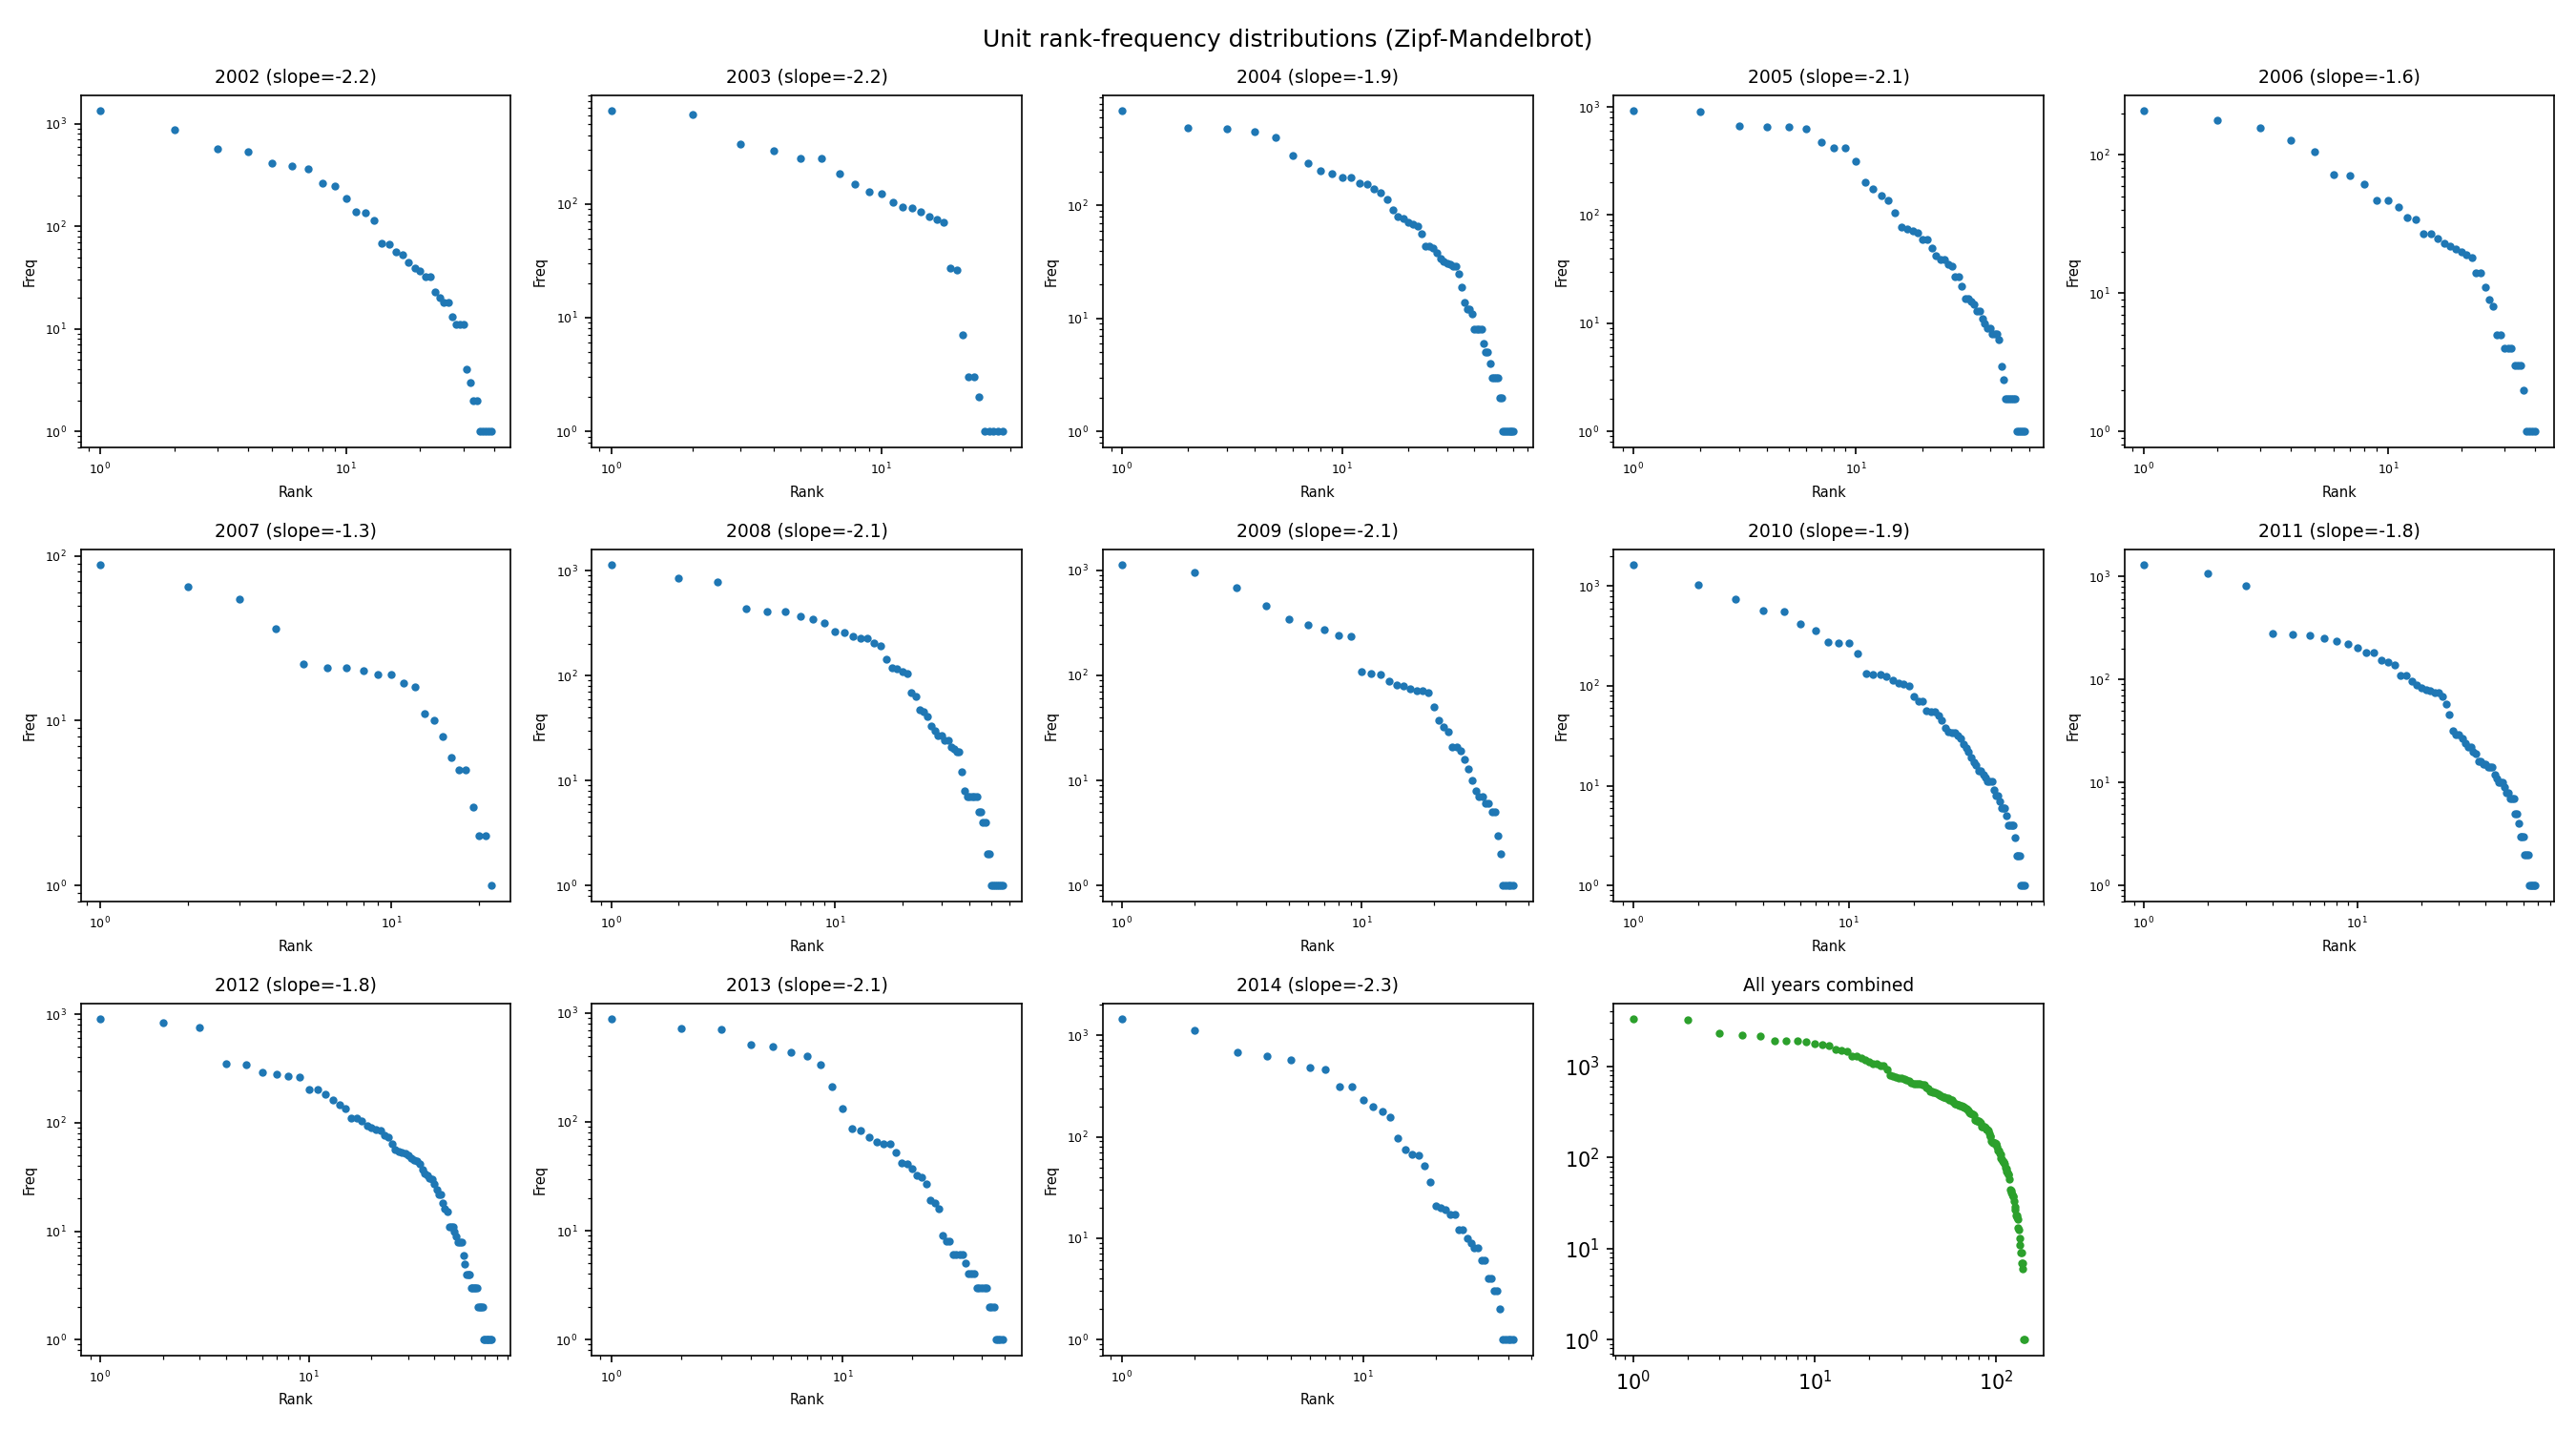
Rank-frequency plot from zipf_frequency_fit.
Menzerath law fit
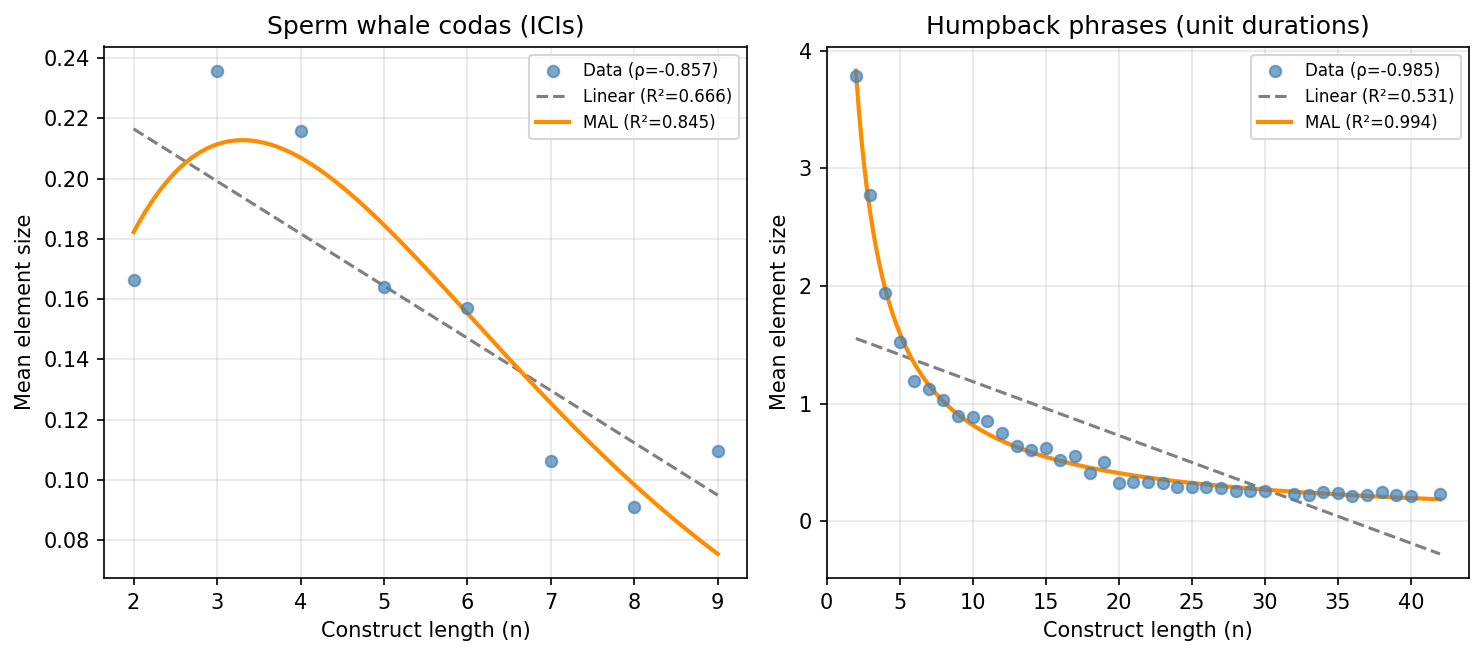
Menzerath's law fit — sequence length vs mean element duration.